
Splat! A quick start.
7th February 2010
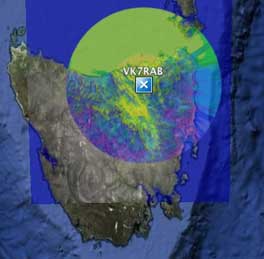
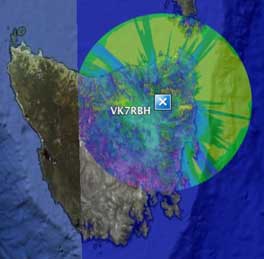
Here are three miniature examples, click the 3rd image on the right to see a much larger plot of of VK7RAA.
With the plot in Google Earth you can zoom right in and see where your house is under the overlay, especially if you make it more transparent.
Here is a detail of VK7RAA's coverage in Launceston taken from the [large plot] on the right above..
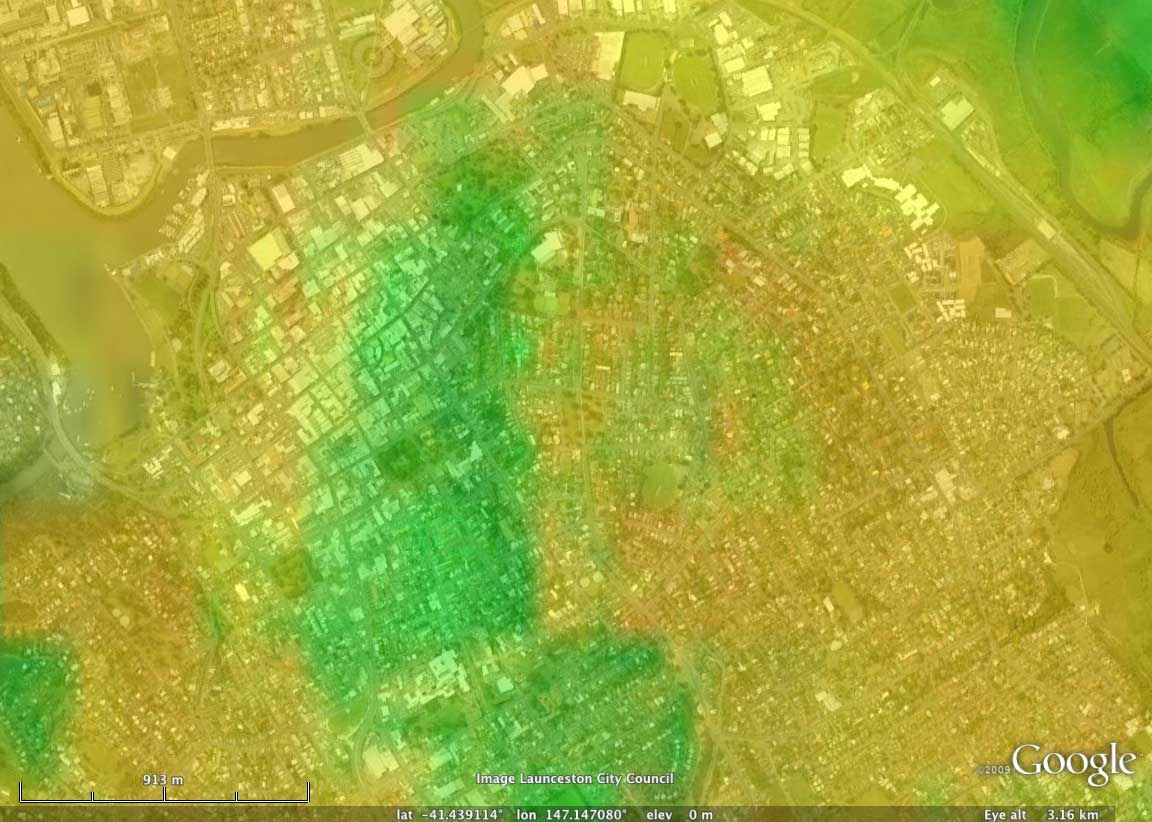 Click the image or click [here] for a larger view. The level of detail is amazing.
Using Bill's splat engine I've registered and carried out Longley-Rice Path Loss Analysis plots for some Tasmanian sites.
Click a callsign to download a zip file containing the splat .jpg and the Google Earth .kml file to view them on your computer.
VK7RAA
VK7RAB
VK7RBH
VK7RNE
VK7RIN
VK7RWC
VK7HAY - Hayden's new home
Millers Bluff
Splat! can also be used for phone towers, here is a zip file for the Telstra NextG tower on Abel's Hill (aka 7EX Hill):
Telstra Abel's Hill site
Bills page below has links to Splat! servers:
[click] W5GFE's Splat! home page
Once you are on a Splat! server these are the steps:
Find a tower's location's coordinates accurately using Google Maps (so you can register the location):
- open Google maps, eg. open this URL in your browser: http://maps.google.com
- search for the place you want to go to, eg. type Weymouth Tas in the search field and hit enter
- zoom in and view the location using terrain or satellite view to obtain the most accurate spot
- right mouse click at the spot and select "What's here?" from the popup menu
- you'll see the coordinates of that spot, eg. -41.013033,147.145407
Enter the tower coordinates for a new Splat location registration:
- enter your details carefully and methodically because there is no way to remove double entries
- the Splat calculations do not seem to like any more than four decimal places; remember -147 is the longitude, -42 is the latitude
- in Australia both the longitude and latitude must have a minus sign in front of them
- make sure you select "Australia" every time from the popup region menu
- enter the height (in feet) of your antenna mast only; the program works out your ground height automatically
- if you need to make corrections to a previous registration, make sure you click the Update radio button or you will create a double entry
Generate your plots from the Terrain or Path links above:
- sometimes the plots can take quite a while so be patient
- the plot jpg which the site generates only stays on the site for a few hours, so don't link to the plot urls
- you can download the plot jpg and kml file from the links on the page that first appears when your new plot is ready
- the colours on the plots represent specific signal levels and [here] is the legend.
Display your area plots:
- download the kml and jpg overlay files from your Splat! calculation results page, keep them together so Google Earth can locate the jpg
- launch Google Earth by double clicking the kml file, not the jpg
- make the coloured overlay jpg more transparent in Google Earth so you can see the ground:
a) right-click the contour link in Google Earth's list of places, b) select Get Info, c) in the overlay Info dialog box move the transparency slider left
Summary for the link between VK7JJ and VK7RBH:
Free space path loss: 122.43 dB
Longley-Rice path loss: 147.40 dB
Attenuation due to effects of terrain: 24.97 dB
Mode of propagation: Single Horizon, Diffraction Dominant
Have fun!
73